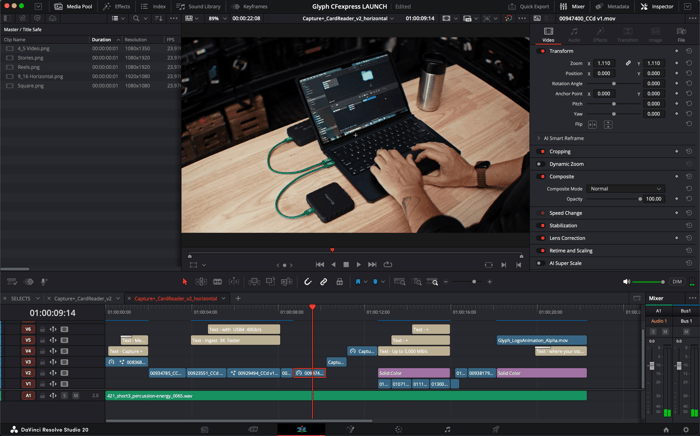
As video editors and photo creators, we are deeply obsessed with cameras, lenses, and lighting. But the most critical piece of gear in our workflow is often completely invisible: our computer's Random Access Memory (RAM). Whether you are rendering a multi-layered 4K timeline in DaVinci Resolve or stacking heavy RAW image exposures in Photoshop, RAM is the vital short-term workspace where your computer holds active assets for instant retrieval.
Unfortunately, many creators inadvertently sabotage their systems before they even open a timeline. They run low-RAM configurations—such as 8GB or 16GB setups—while forcing their computers to juggle dozens of unrelated background applications.
This post breaks down the "One App" Challenge: a workflow methodology designed to reclaim your short-term storage, reduce drive thrashing, and optimize performance without spending a dime on hardware upgrades.
The Invisible Saboteurs: Background RAM Hogs
Modern communication tools, web browsers, and media players are built on resource-heavy frameworks like Electron, which essentially wrap full web browser engines inside standalone applications. When you leave Google Chrome, Spotify, Discord, or Slack running while trying to edit video, you force your system to split its finite memory pools.
When system RAM fills up near capacity, modern operating systems like Windows 11 and macOS utilize a mechanism called virtual memory swapping. The OS begins writing temporary data out to your storage drive (SSD) to act as secondary "overflow" RAM. While fast NVMe SSDs mitigate some slowdowns, this continuous data exchange introduces microscopic frame drops, micro-stutters, and lag into your real-time editing timeline.
Taking the "One App" Challenge
The rules of the challenge are deceptively simple but require a swift change in daily editing habits. Before you double-click your NLE or photo-editing software icon, you must enforce a strict environmental rule: Only the operating system and your primary creative application are allowed to remain open.
Commit to the Clean Slate: Close every single browser tab. If you have research materials or asset download links open, save them to a bookmark folder or workspace manager to recall later.
Kill the Electron Suite: Fully quit desktop instances of Slack, Discord, and Spotify. If you must listen to music while working, consider using an external device like a smartphone or tablet to offload the audio processing entirely.
Disable Automated Syncing: Pause active background sync operations from cloud clients (such as Dropbox, Google Drive, or OneDrive). These tools frequently index files and trigger high CPU and memory pool utilization during asset exports.
💡 Pro-Tip: The ultimate pre-session habit is a clean machine reboot. Restarting your computer right before initiating a heavy editing or final export session flushes out fragmented memory caches, clears leaked memory allocations from crashed background processes, and establishes a pristine system architecture.
How to Hunt Down RAM Hogs
To fully understand where your memory is disappearing, you must leverage the built-in diagnostic tools native to your operating system rather than relying on unoptimized third-party "cleaner" utilities.
On Windows: Mastering Task Manager
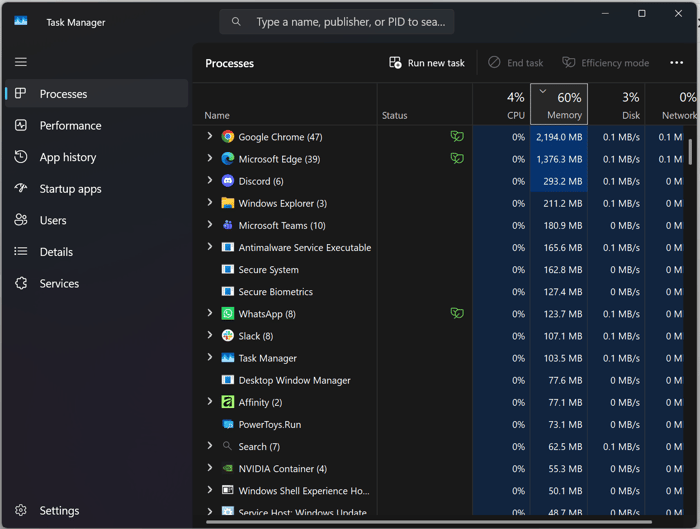
Launch the system monitor by pressing Ctrl + Shift + Esc. Navigate directly to the Processes tab and single-click the Memory column header to sort your software from highest to lowest usage. Look for runaway browser helper processes or hidden update utilities that are quietly holding onto hundreds of megabytes of physical memory.
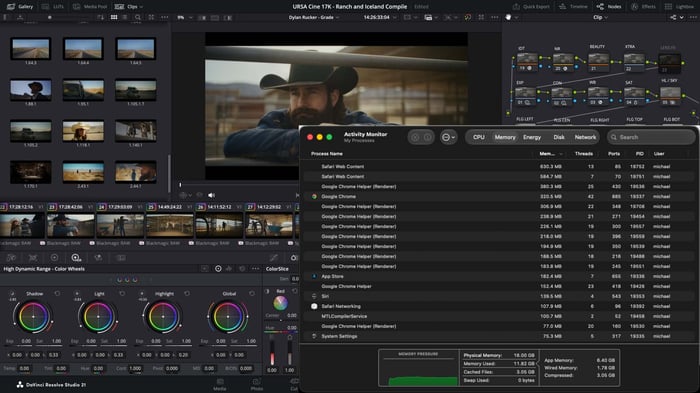
On macOS: Interpreting Activity Monitor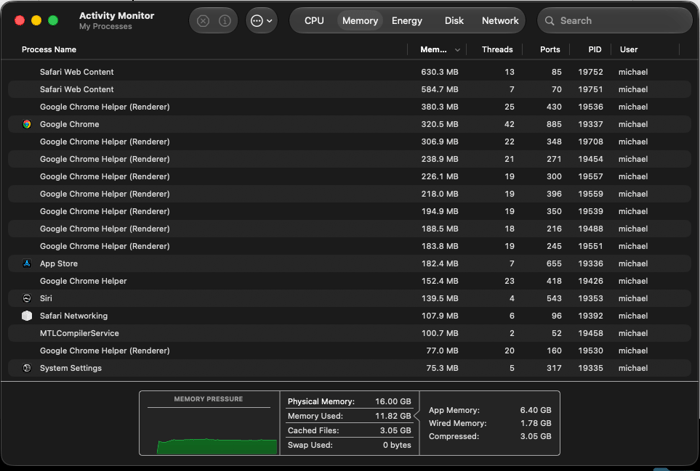
Open your utilities directory and launch Activity Monitor, then step into the Memory tab. Instead of focusing solely on raw gigabyte counts, turn your attention to the Memory Pressure Graph at the bottom. A steady green graph indicates a healthy allocation environment. If the chart shifts into yellow or red, your Mac is actively swapping data to disk, indicating that background apps must be culled immediately to preserve hardware performance.
Conclusion: Work Smarter, Not Harder
Upgrading your hardware is not always an immediate financial or logistical option, especially on contemporary laptops with soldered-down system components. By adopting the "One App" workflow, you eliminate internal system friction, free up massive quantities of high-speed short-term memory, and ensure your editing software receives the complete focus of your system resources. Clean up your digital workspace before your next edit—your timeline will thank you.
Further Reading:
Windows Central: I tested Microsoft PC Manager's RAM-freeing tool and learned why high memory usage isn't always a problem
TWiT.tv: Activity Monitor Explained: Stop Slowdowns on Your Mac Fast
WindowsForum Guides: Fix High RAM Usage in Windows 10/11: Find Memory Hogs, Limit Background Apps, and Stop Leaks
MakeUseOf Technical: How to Identify and Fix High Memory Usage With Task Manager
OS X Daily: Activity Monitor for Mac: What It Is, How to Use It, & Why